class: center, middle, inverse, title-slide # Introduction to RNA-Seq ## Introduction To Bioinformatics Using NGS Data ### <b>Roy Francis</b> | 12-Sep-2018 --- layout: true <link href="https://fonts.googleapis.com/css?family=Lato:400,700|Roboto:400,700" rel="stylesheet"> <link rel="stylesheet" href="https://use.fontawesome.com/releases/v5.3.1/css/all.css" integrity="sha384-mzrmE5qonljUremFsqc01SB46JvROS7bZs3IO2EmfFsd15uHvIt+Y8vEf7N7fWAU" crossorigin="anonymous"> --- name: contents class: spaced ## Contents * [Why RNA-Seq?](#intro) * [Workflow](#workflow) * [DGE Workflow](#workflow-dge) * [ReadQC](#read-qc) * [Mapping](#mapping-intro) * [Alignment QC](#alignment-qc) * [Quantification](#quantification-counts) * [Normalisation](#normalisation) * [Exploratory](#exploratory-heatmap) * [DGE](#dge-1) * [Functional analyses](#functional-analysis-1) * [Single-cell RNA-Seq](#sc-1) * [Summary](#summary) * [Help](#help) --- name: intro class: spaced ## Why sequence RNA?  - The transcriptome is spatially and temporally dynamic - Data comes from functional units (coding regions) - Only a tiny fraction of the genome --- name: applications class: spaced ## Applications - Identify gene sequences in genomes - Learn about gene function - Differential gene expression - Explore isoform and allelic expression - Understand co-expression, pathways and networks - Gene fusion - RNA editing --- name: workflow class: spaced ## Workflow .size-80[] <img src="images/sequence.jpg" style="height:250px; position:fixed; right:0px; bottom:0px; margin-right: 100px; margin-bottom: 130px; border-radius:4px;"> .citation[ <span style="display:block;"><i class="fas fa-link"></i> Conesa, Ana, *et al.* "A survey of best practices for RNA-seq data analysis." [Genome biology 17.1 (2016): 13](https://genomebiology.biomedcentral.com/articles/10.1186/s13059-016-0881-8)</span> ] --- name: exp-design class: spaced ## Experimental design - Balanced design - Technical replicates not necessary (.medium[.altcol[Marioni *et al.*, 2008]]) - Biological replicates: 6 - 12 (.medium[.altcol[Schurch *et al.*, 2016]]) - ENCODE consortium - Previous publications - Power analysis .size-60[] <i class="fas fa-toolbox"></i> [RnaSeqSampleSize](https://cqs.mc.vanderbilt.edu/shiny/RnaSeqSampleSize/) (Power analysis), [Scotty](http://scotty.genetics.utah.edu/) (Power analysis with cost) .citation[ <span style="display:block;"><i class="fas fa-link"></i> Busby, Michele A., *et al.* "Scotty: a web tool for designing RNA-Seq experiments to measure differential gene expression." [Bioinformatics 29.5 (2013): 656-657](https://academic.oup.com/bioinformatics/article/29/5/656/252753)</span> <span style="display:block;"><i class="fas fa-link"></i> Marioni, John C., *et al.* "RNA-seq: an assessment of technical reproducibility and comparison with gene expression arrays." [Genome research (2008)](https://genome.cshlp.org/content/18/9/1509.long)</span> <span style="display:block;"><i class="fas fa-link"></i> Schurch, Nicholas J., *et al.* "How many biological replicates are needed in an RNA-seq experiment and which differential expression tool should you use?." [Rna (2016)](http://rnajournal.cshlp.org/content/early/2016/03/30/rna.053959.115.abstract)</span> <span style="display:block;"><i class="fas fa-link"></i> Zhao, Shilin, *et al.* "RnaSeqSampleSize: real data based sample size estimation for RNA sequencing." [BMC bioinformatics 19.1 (2018): 191](https://bmcbioinformatics.biomedcentral.com/articles/10.1186/s12859-018-2191-5)</span> ] --- name: rna-extraction class: spaced ## RNA extraction - Sample processing and storage - Total RNA/mRNA/small RNA - DNAse treatment - Quantity & quality - RIN values (Strong effect) - Batch effect .citation[ <span style="display:block;"><i class="fas fa-link"></i> Romero, Irene Gallego, et al. "RNA-seq: impact of RNA degradation on transcript quantification." [BMC biology 12.1 (2014): 42](https://bmcbiol.biomedcentral.com/articles/10.1186/1741-7007-12-42)</span> ] --- name: library-prep class: spaced ## Library prep .pull-left-50[ - PolyA selection - rRNA depletion - Size selection - PCR amplification (.medium[See section PCR duplicates]) - Stranded (directional) libraries - Accurately identify sense/antisense transcript - Resolve overlapping genes - Exome capture - Library normalisation - Batch effect ] .pull-right-50[  ] .citation[ <span style="display:block;"><i class="fas fa-link"></i> Zhao, Shanrong, et al. "Comparison of stranded and non-stranded RNA-seq transcriptome profiling and investigation of gene overlap." [BMC genomics 16.1 (2015): 675](https://www.ncbi.nlm.nih.gov/pmc/articles/PMC4559181/)</span> <span style="display:block;"><i class="fas fa-link"></i> Levin, Joshua Z., et al. "Comprehensive comparative analysis of strand-specific RNA sequencing methods." [Nature methods 7.9 (2010): 709](https://www.nature.com/articles/nmeth.1491)</span> ] --- name: sequencing ## Sequencing .pull-left-60[ - Sequencer (Illumina/PacBio) - Read length - .medium[Greater than 50bp does not improve DGE] - .medium[Longer reads better for isoforms] - Pooling samples - Sequencing depth (.medium[Coverage/Reads per sample]) - Single-end reads (.medium[Cheaper]) - Paired-end reads - .medium[Increased mappable reads] - .medium[Increased power in assemblies] - .medium[Better for structural variation and isoforms] - .medium[Decreased false-positives for DGE] ] .pull-right-40[  ] .citation[ <span style="display:block;"><i class="fas fa-link"></i> Chhangawala, Sagar, et al. "The impact of read length on quantification of differentially expressed genes and splice junction detection." [Genome biology 16.1 (2015): 131](https://www.ncbi.nlm.nih.gov/pmc/articles/PMC4531809/)</span> <span style="display:block;"><i class="fas fa-link"></i> Corley, Susan M., et al. "Differentially expressed genes from RNA-Seq and functional enrichment results are affected by the choice of single-end versus paired-end reads and stranded versus non-stranded protocols." [BMC genomics 18.1 (2017): 399](https://www.ncbi.nlm.nih.gov/pmc/articles/PMC5442695/)</span> <span style="display:block;"><i class="fas fa-link"></i> Liu, Yuwen, Jie Zhou, and Kevin P. White. "RNA-seq differential expression studies: more sequence or more replication?." [Bioinformatics 30.3 (2013): 301-304](https://academic.oup.com/bioinformatics/article/30/3/301/228651)</span> <span style="display:block;"><i class="fas fa-link"></i> Comparison of PE and SE for RNA-Seq, [SciLifeLab](https://ngisweden.scilifelab.se/file/1540-1_Comparison_of_PE_and_SE_for_RNA-seq.pdf)</span> ] --- name: workflow-dge ## Workflow | DGE  --- name: de-novo-assembly class: spaced ## De-Novo assembly - When no reference genome available - To identify novel genes/transcripts/isoforms - Identify fusion genes - Assemble transcriptome from short reads - Access quality of assembly and refine - Map reads back to assembled transcriptome <i class="fas fa-toolbox"></i> [Trinity](https://github.com/trinityrnaseq/trinityrnaseq/wiki), [SOAPdenovo-Trans](http://soap.genomics.org.cn/SOAPdenovo-Trans.html), [Oases](https://www.ebi.ac.uk/~zerbino/oases/), [rnaSPAdes](http://cab.spbu.ru/software/rnaspades/) .citation[ <span style="display:block;"><i class="fas fa-link"></i> Hsieh, Ping-Han *et al*., "Effect of de novo transcriptome assembly on transcript quantification" [2018 bioRxiv 380998](https://www.biorxiv.org/content/early/2018/08/22/380998)</span> <span style="display:block;"><i class="fas fa-link"></i> Wang, Sufang, and Michael Gribskov. "Comprehensive evaluation of de novo transcriptome assembly programs and their effects on differential gene expression analysis." [Bioinformatics 33.3 (2017): 327-333](https://academic.oup.com/bioinformatics/article/33/3/327/2580374)</span> ] --- name: read-qc ## Read QC - Number of reads - Per base sequence quality - Per sequence quality score - Per base sequence content - Per sequence GC content - Per base N content - Sequence length distribution - Sequence duplication levels - Overrepresented sequences - Adapter content - Kmer content <img src="images/qc.jpg" style="height:250px; position:fixed; right:0px; bottom: 0px; margin-right: 100px; margin-bottom: 310px;"> <i class="fas fa-toolbox"></i> [FastQC](https://www.bioinformatics.babraham.ac.uk/projects/fastqc/), [MultiQC](http://multiqc.info/) https://sequencing.qcfail.com/  --- name: read-qc-2 ## Read QC | PBSQ, PSQS .size-90[.vsmall[**Per base sequence quality**] 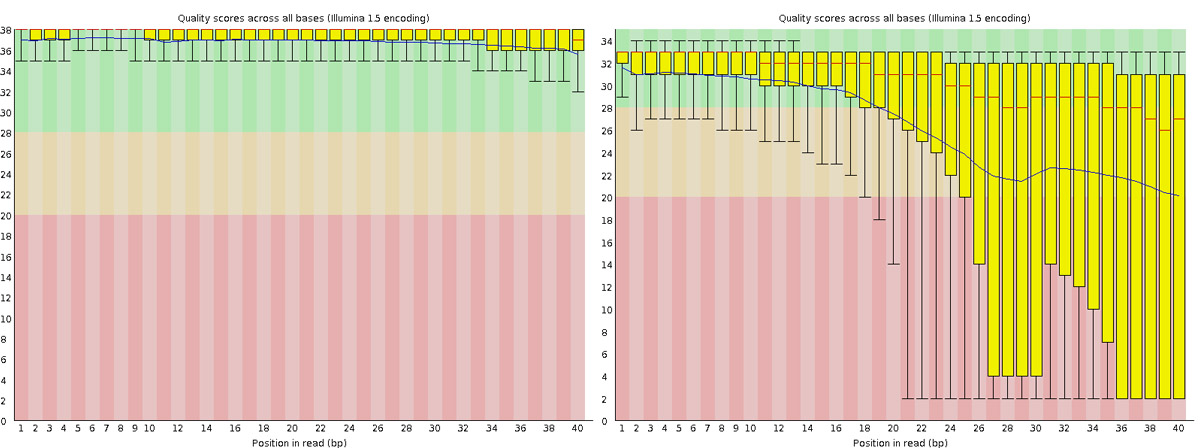] .size-90[.vsmall[**Per sequence quality scores**] 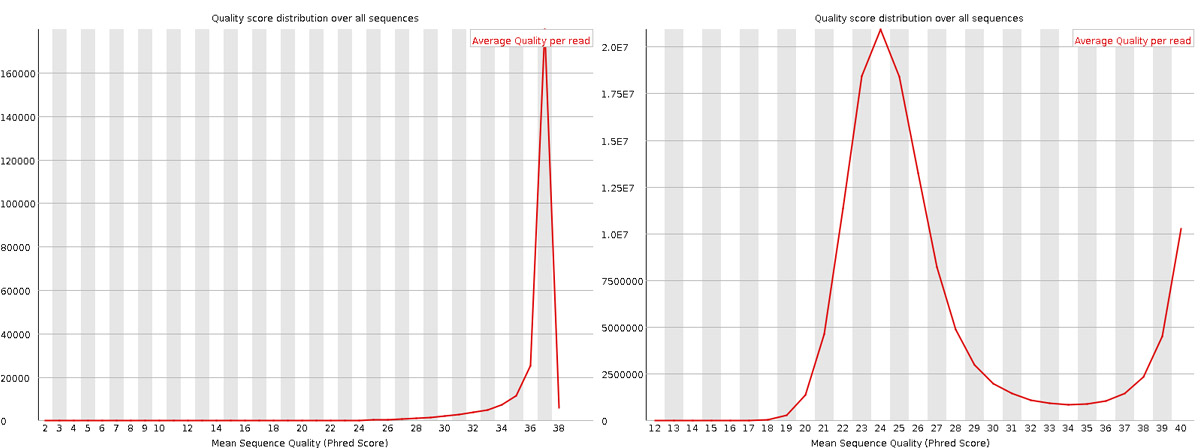] --- name: read-qc-3 ## Read QC | PBSC, PSGC .size-90[.vsmall[**Per base sequence content**] 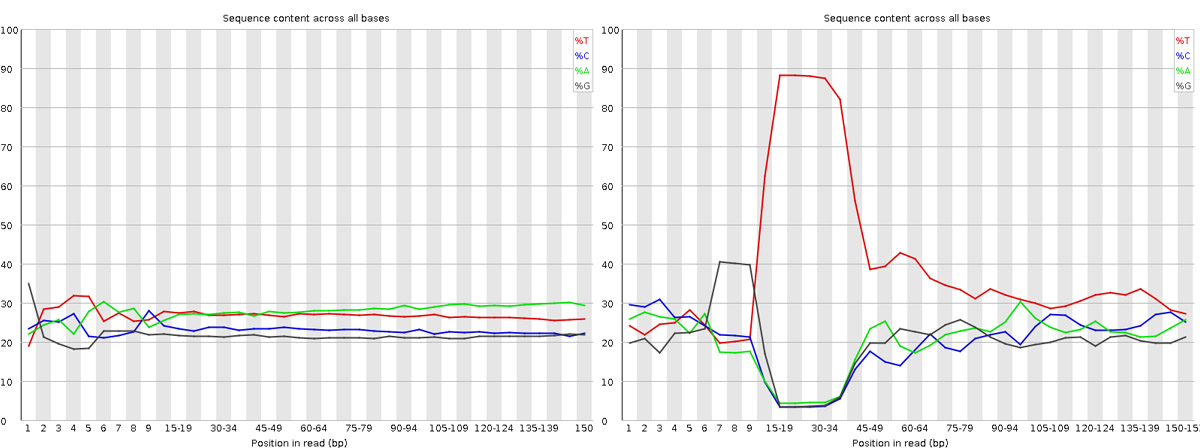] .size-90[.vsmall[**Per sequence GC content**] 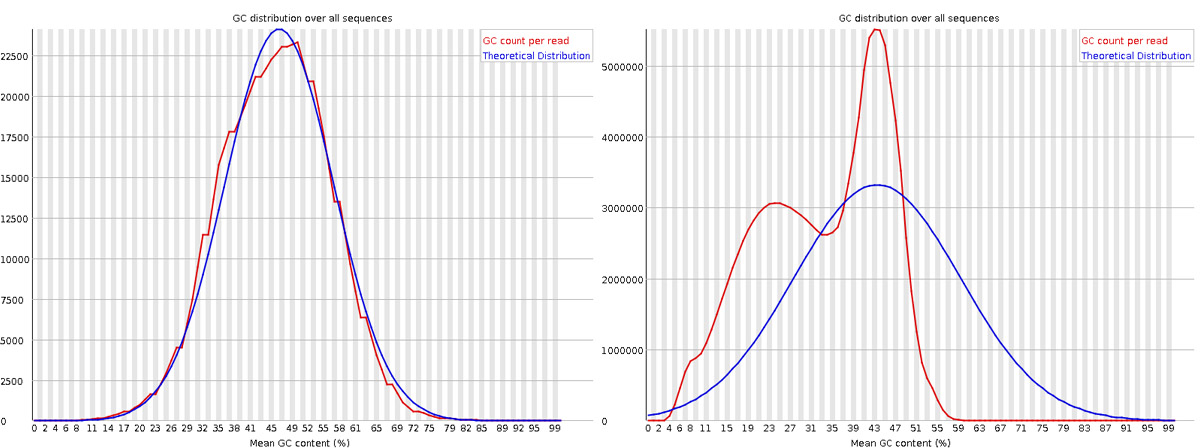] --- name: read-qc-4 ## Read QC | SDL, AC .size-90[.vsmall[**Sequence duplication level**] ] .size-90[.vsmall[**Adapter content**] ] --- name: trimming ## Trimming .pull-left-50[ - Trim IF necessary - Synthetic bases can be an issue for SNP calling - Insert size distribution may be more important for assemblers - Trim/Clip/Filter reads - Remove adapter sequences - Trim reads by quality - Sliding window trimming - Filter by min/max read length - Remove reads less than ~22nt - Demultiplexing/Splitting <i class="fas fa-toolbox"></i> [Cutadapt](https://github.com/marcelm/cutadapt/), [fastp](https://github.com/OpenGene/fastp), [Skewer](https://github.com/relipmoc/skewer), [Prinseq](http://prinseq.sourceforge.net/) ] .pull-right-50[  ] --- name: mapping-intro ## Mapping  - Aligning reads back to a reference sequence - Mapping to genome vs transcriptome - Splice-aware alignment (genome) <i class="fas fa-toolbox"></i> [STAR](https://github.com/alexdobin/STAR), [HiSat2](https://ccb.jhu.edu/software/hisat2/index.shtml), [GSNAP](http://research-pub.gene.com/gmap/), [Novoalign](http://www.novocraft.com/products/novoalign/) (Commercial) .citation[ <span style="display:block;"><i class="fas fa-link"></i> Baruzzo, Giacomo, *et al*. "Simulation-based comprehensive benchmarking of RNA-seq aligners." [Nature methods 14.2 (2017): 135](https://www.nature.com/articles/nmeth.4106)</span> ] --- name: mapping-required ## Mapping - Reads (FASTQ) ``` @ST-E00274:179:HHYMLALXX:8:1101:1641:1309 1:N:0:NGATGT NCATCGTGGTATTTGCACATCTTTTCTTATCAAATAAAAAGTTTAACCTACTCAGTTATGCGCATACGTTTTTTGATGGCATTTCCATAAACCGATTTTTTTTTTATGCACGTACCCAAAACGTGCAGAAAAATACGCTGCTAGAAATGTA + #AAAFAFA<-AFFJJJAFA-FFJJJJFFFAJJJJ-<FFJJJ-A-F-7--FA7F7-----FFFJFA<FFFFJ<AJ--FF-A<A-<JJ-7-7-<FF-FFFJAFFAA--A--7FJ-7----77-A--7F7)---7F-A----7)7-----7<<- ``` `@instrument:runid:flowcellid:lane:tile:xpos:ypos read:isfiltered:controlnumber:sampleid` - Reference Genome/Transcriptome (FASTA) ``` >1 dna:chromosome chromosome:GRCz10:1:1:58871917:1 REF GATCTTAAACATTTATTCCCCCTGCAAACATTTTCAATCATTACATTGTCATTTCCCCTC CAAATTAAATTTAGCCAGAGGCGCACAACATACGACCTCTAAAAAAGGTGCTGTAACATG ``` - Annotation (GTF/GFF) ``` #!genome-build GRCz10 #!genebuild-last-updated 2016-11 4 ensembl_havana gene 6732 52059 . - . gene_id "ENSDARG00000104632"; gene_version "2"; gene_name "rerg"; gene_source "ensembl_havana"; gene_biotype "protein_coding"; havana_gene "OTTDARG00000044080"; havana_gene_version "1"; ``` `seq source feature start end score strand frame attribute` .citation[ <i class="fas fa-link"></i> Illumina read name [format](http://support.illumina.com/content/dam/illumina-support/help/BaseSpaceHelp_v2/Content/Vault/Informatics/Sequencing_Analysis/BS/swSEQ_mBS_FASTQFiles.htm), GTF [format](https://www.ensembl.org/info/website/upload/gff.html) ] --- name: alignment ## Alignment - SAM/BAM (Sequence Alignment Map format) ``` ST-E00274:188:H3JWNCCXY:4:1102:32431:49900 163 1 1 60 8S139M4S = 385 535 TATTTAGAGATCTTAAACATCCATTCCCCCTGCAAACATTTTCAATCATTACATTGTCATTTTCCCTCCAAATTAAATTTAGCCAGAGGCGCACAACATACGACCTCTAAAAAAGGTGCTGGAACATGTACCTATATGCAGCACCACCATC AAAFAFFAFFFFJ7FFFFJ<JAFA7F-<AJ7JJ<FFFJ--<FAJF<7<7FAFJ-<AFA<-JJJ-AF-AJ-FF<F--A<FF<-7777-7JA-77A---F-7AAFF-FJA--77FJ<--77)))7<JJA<J77<-------<7--))7)))7- NM:i:4 MD:Z:12T0T40C58T25 AS:i:119 XS:i:102 XA:Z:17,-53287490,4S33M4D114M,11; MQ:i:60 MC:Z:151M RG:Z:ST-E00274_188_H3JWNCCXY_4 ``` `query flag ref pos mapq cigar mrnm mpos tlen seq qual opt` <i class="fas fa-toolbox"></i> [SeqMonk](https://www.bioinformatics.babraham.ac.uk/projects/seqmonk/), [IGV](http://software.broadinstitute.org/software/igv/), [UCSC Genome Browser](https://genome.ucsc.edu/)  .citation[ <span style="display:block;"><i class="fas fa-link"></i> SAM file [format](http://www.htslib.org/doc/sam.html)</span> ] --- name: alignment-qc class: spaced ## Alignment QC - Number of reads mapped/unmapped/paired etc - Uniquely mapped - Insert size distribution - Gene body coverage - Biotype counts / Chromosome counts - Counts by region: gene/intron/non-genic <i class="fas fa-toolbox"></i> STAR (final log file), samtools > stats, bamtools > stats, [QoRTs](https://hartleys.github.io/QoRTs/), [RSeQC](http://rseqc.sourceforge.net/), [Qualimap](http://qualimap.bioinfo.cipf.es/) --- name: star-log ## Alignment QC | STAR Log MultiQC can be used to summarise and plot STAR log files.  --- name: samtools-stats ## BAM QC | samtools `samtools stats file.bam` ``` SN raw total sequences: 522095280 SN filtered sequences: 0 SN sequences: 522095280 SN is sorted: 1 SN 1st fragments: 261047640 SN last fragments: 261047640 SN reads mapped: 514139025 SN reads mapped and paired: 510035006 SN reads unmapped: 7956255 SN reads properly paired: 460249078 SN reads paired: 522095280 SN reads duplicated: 60151694 SN reads MQ0: 54098384 SN reads QC failed: 0 SN non-primary alignments: 15023188 SN total length: 78437013272 SN bases mapped: 77238941462 SN bases mapped (cigar): 74139898333 SN bases trimmed: 0 SN bases duplicated: 9022025650 SN mismatches: 1695194781 SN error rate: 2.286481e-02 SN average length: 150 SN maximum length: 151 SN average quality: 37.6 ... ``` --- name: bamtools-stats ## BAM QC | bamtools `bamtools stats file.bam` ``` ********************************************** Stats for BAM file(s): ********************************************** Total reads: 537118468 Mapped reads: 529162213 (98.5187%) Forward strand: 270376825 (50.3384%) Reverse strand: 266741643 (49.6616%) Failed QC: 0 (0%) Duplicates: 61425418 (11.4361%) Paired-end reads: 537118468 (100%) 'Proper-pairs': 465991264 (86.7576%) Both pairs mapped: 524501668 (97.651%) Read 1: 268374707 Read 2: 268743761 Singletons: 4660545 (0.867694%) ``` --- name: qorts-region ## QoRTs QoRTs was run on all samples and summarised using MultiQC.  --- name: qorts-plots ## QoRTs  --- name: quantification-counts class: spaced ## Quantification | Counts .pull-left-50[ - Read counts = gene expression - Reads can be quantified on any feature (gene, transcript, exon etc) - Intersection on gene models - Gene/Transcript level  <i class="fas fa-toolbox"></i> [featureCounts](http://bioinf.wehi.edu.au/featureCounts/), [HTSeq](https://github.com/simon-anders/htseq) ] .pull-right-50[ .size-85[.center[]] ] --- name: pcr-duplicates ## Quantification | PCR duplicates - Ignore for RNA-Seq data - Computational deduplication (Don't!) - Use PCR-free library-prep kits - Use UMIs .citation[ <span style="display:block;"><i class="fas fa-link"></i> Fu, Yu, *et al*. "Elimination of PCR duplicates in RNA-seq and small RNA-seq using unique molecular identifiers." [BMC genomics 19.1 (2018): 531](https://bmcgenomics.biomedcentral.com/articles/10.1186/s12864-018-4933-1)</span> <span style="display:block;"><i class="fas fa-link"></i> Parekh, Swati, *et al*. "The impact of amplification on differential expression analyses by RNA-seq." [Scientific reports 6 (2016): 25533](https://www.nature.com/articles/srep25533)</span> <span style="display:block;"><i class="fas fa-link"></i> Klepikova, Anna V., *et al*. "Effect of method of deduplication on estimation of differential gene expression using RNA-seq." [PeerJ 5 (2017): e3091](https://www.ncbi.nlm.nih.gov/pmc/articles/PMC5357343/)</span> ] --- name: multi-mapping ## Quantification | Multi-mapping .pull-left-50[ - Added (.medium[BEDTools multicov]) - Discard (.medium[featureCounts, HTSeq]) - Distribute counts (.medium[Cufflinks]) - Rescue - Probabilistic assignment (.medium[Rcount, Cufflinks]) - Prioritise features (.medium[Rcount]) - Probabilistic assignment with EM (.medium[RSEM]) ] .pull-right-50[ .center[] ] .citation[ <span style="display:block;"><i class="fas fa-link"></i>Schmid, Marc W., and Ueli Grossniklaus. "Rcount: simple and flexible RNA-Seq read counting." [Bioinformatics 31.3 (2014): 436-437](https://academic.oup.com/bioinformatics/article/31/3/436/2366259)</span> ] --- name: quantification-abundance ## Quantification | Abundance - Count methods - Provide no inference on isoforms - Cannot accurately measure fold change <!--.size-60[]--> - Probabilistic assignment - Deconvolute ambiguous mappings - Transcript-level - cDNA reference **Kallisto, Salmon** - Ultra-fast & alignment-free - Subsampling & quantification confidence - Transcript-level estimates improves gene-level estimates - Kallisto/Salmon > transcript-counts > `tximport()` > gene-counts <i class="fas fa-toolbox"></i> [RSEM](https://deweylab.github.io/RSEM/), [Kallisto](https://pachterlab.github.io/kallisto/), [Salmon](https://combine-lab.github.io/salmon/), [Cufflinks2](http://cole-trapnell-lab.github.io/cufflinks/) .citation[ <span style="display:block;"><i class="fas fa-link"></i> Soneson, Charlotte, *et al*. "Differential analyses for RNA-seq: transcript-level estimates improve gene-level inferences." [F1000Research 4 (2015)](https://f1000research.com/articles/4-1521/v2)</span> <span style="display:block;"><i class="fas fa-link"></i> Zhang, Chi, *et al*. "Evaluation and comparison of computational tools for RNA-seq isoform quantification." [BMC genomics 18.1 (2017): 583](https://bmcgenomics.biomedcentral.com/articles/10.1186/s12864-017-4002-1)</span> ] --- name: quantification-qc ## Quantification QC ``` ENSG00000000003 140 242 188 143 287 344 438 280 253 ENSG00000000005 0 0 0 0 0 0 0 0 0 ENSG00000000419 69 98 77 55 52 94 116 79 69 ENSG00000000457 56 75 104 79 157 205 183 178 153 ENSG00000000460 33 27 23 19 27 42 69 44 40 ENSG00000000938 7 38 13 17 35 76 53 37 24 ENSG00000000971 545 878 694 636 647 216 492 798 323 ENSG00000001036 79 154 74 80 128 167 220 147 72 ``` .pull-left-50[ - Pairwise correlation between samples must be high (>0.9) .size-60[] ] .pull-right-50[ - Count QC using RNASeqComp .size-80[] ] <i class="fas fa-toolbox"></i> [RNASeqComp](https://bioconductor.org/packages/release/bioc/html/rnaseqcomp.html) .citation[ <span style="display:block;"><i class="fas fa-link"></i> Teng, Mingxiang, *et al*. "A benchmark for RNA-seq quantification pipelines." [Genome biology 17.1 (2016): 74](https://genomebiology.biomedcentral.com/articles/10.1186/s13059-016-0940-1)</span> ] --- name: normalisation ## Normalisation - Control for Sequencing depth & compositional bias - Median of Ratios (DESeq2) and TMM (edgeR) perform the best  - FoR DGE using DGE packages, use raw counts - For clustering, heatmaps etc use VST, VOOM or RLOG - For own analysis, plots etc, use TPM - Other solutions: spike-ins/house-keeping genes <img src="images/distribution.jpg" style="height:240px; position:fixed; right:0px; bottom: 0px; margin-right: 70px; margin-bottom: 140px;"> .citation[ <span style="display:block;"><i class="fas fa-link"></i> Dillies, Marie-Agnes, *et al*. "A comprehensive evaluation of normalization methods for Illumina high-throughput RNA sequencing data analysis." [Briefings in bioinformatics 14.6 (2013): 671-683](https://www.ncbi.nlm.nih.gov/pubmed/22988256)</span> <span style="display:block;"><i class="fas fa-link"></i> Evans, Ciaran, Johanna Hardin, and Daniel M. Stoebel. "Selecting between-sample RNA-Seq normalization methods from the perspective of their assumptions." [Briefings in bioinformatics (2017)](https://arxiv.org/abs/1609.00959)</span> <span style="display:block;"><i class="fas fa-link"></i> Wagner, Gunter P., Koryu Kin, and Vincent J. Lynch. "Measurement of mRNA abundance using RNA-seq data: RPKM measure is inconsistent among samples." [Theory in biosciences 131.4 (2012): 281-285](https://link.springer.com/article/10.1007/s12064-012-0162-3)</span> ] --- name: exploratory-heatmap ## Exploratory | Heatmap - Remove lowly expressed genes - Transform raw counts to VST, VOOM, RLOG, TPM etc - Sample-sample clustering heatmap <img src="talk_files/figure-html/unnamed-chunk-6-1.svg" style="display: block; margin: auto auto auto 0;" /> <i class="fas fa-toolbox"></i> [`pheatmap()`](https://github.com/raivokolde/pheatmap) --- name: exploratory-mds ## Exploratory | MDS <div id="htmlwidget-5471dce4f713cf8f3695" style="width:750px;height:500px;" class="plotly html-widget"></div> <script type="application/json" data-for="htmlwidget-5471dce4f713cf8f3695">{"x":{"visdat":{"3d38304965d5":["function () ","plotlyVisDat"]},"cur_data":"3d38304965d5","attrs":{"3d38304965d5":{"x":{},"y":{},"z":{},"text":{},"hoverinfo":"text","colors":["#A6CEE3","#1F78B4","#B2DF8A","#33A02C","#FB9A99","#E31A1C","#FDBF6F","#FF7F00"],"alpha_stroke":1,"sizes":[10,100],"spans":[1,20],"type":"scatter3d","mode":"markers","color":{},"inherit":true}},"layout":{"width":750,"height":500,"margin":{"b":40,"l":60,"t":25,"r":10},"scene":{"xaxis":{"title":"V1"},"yaxis":{"title":"V2"},"zaxis":{"title":"V3"}},"hovermode":"closest","showlegend":true},"source":"A","config":{"modeBarButtonsToAdd":[{"name":"Collaborate","icon":{"width":1000,"ascent":500,"descent":-50,"path":"M487 375c7-10 9-23 5-36l-79-259c-3-12-11-23-22-31-11-8-22-12-35-12l-263 0c-15 0-29 5-43 15-13 10-23 23-28 37-5 13-5 25-1 37 0 0 0 3 1 7 1 5 1 8 1 11 0 2 0 4-1 6 0 3-1 5-1 6 1 2 2 4 3 6 1 2 2 4 4 6 2 3 4 5 5 7 5 7 9 16 13 26 4 10 7 19 9 26 0 2 0 5 0 9-1 4-1 6 0 8 0 2 2 5 4 8 3 3 5 5 5 7 4 6 8 15 12 26 4 11 7 19 7 26 1 1 0 4 0 9-1 4-1 7 0 8 1 2 3 5 6 8 4 4 6 6 6 7 4 5 8 13 13 24 4 11 7 20 7 28 1 1 0 4 0 7-1 3-1 6-1 7 0 2 1 4 3 6 1 1 3 4 5 6 2 3 3 5 5 6 1 2 3 5 4 9 2 3 3 7 5 10 1 3 2 6 4 10 2 4 4 7 6 9 2 3 4 5 7 7 3 2 7 3 11 3 3 0 8 0 13-1l0-1c7 2 12 2 14 2l218 0c14 0 25-5 32-16 8-10 10-23 6-37l-79-259c-7-22-13-37-20-43-7-7-19-10-37-10l-248 0c-5 0-9-2-11-5-2-3-2-7 0-12 4-13 18-20 41-20l264 0c5 0 10 2 16 5 5 3 8 6 10 11l85 282c2 5 2 10 2 17 7-3 13-7 17-13z m-304 0c-1-3-1-5 0-7 1-1 3-2 6-2l174 0c2 0 4 1 7 2 2 2 4 4 5 7l6 18c0 3 0 5-1 7-1 1-3 2-6 2l-173 0c-3 0-5-1-8-2-2-2-4-4-4-7z m-24-73c-1-3-1-5 0-7 2-2 3-2 6-2l174 0c2 0 5 0 7 2 3 2 4 4 5 7l6 18c1 2 0 5-1 6-1 2-3 3-5 3l-174 0c-3 0-5-1-7-3-3-1-4-4-5-6z"},"click":"function(gd) { \n // is this being viewed in RStudio?\n if (location.search == '?viewer_pane=1') {\n alert('To learn about plotly for collaboration, visit:\\n https://cpsievert.github.io/plotly_book/plot-ly-for-collaboration.html');\n } else {\n window.open('https://cpsievert.github.io/plotly_book/plot-ly-for-collaboration.html', '_blank');\n }\n }"}],"cloud":false},"data":[{"x":[-5.33185049177959,-7.92209817002156,-8.77692340480147],"y":[0.0432736817716184,-1.26280672685875,-1.86761681936745],"z":[1.04060988518825,-1.41087805672964,-2.80687594167858],"text":["<b>ID: <\/b>121T10571_121<br /><b>NGS ID: <\/b>P8304_117","<b>ID: <\/b>121T10571_123<br /><b>NGS ID: <\/b>P8304_119","<b>ID: <\/b>121T10571_124<br /><b>NGS ID: <\/b>P8304_120"],"hoverinfo":["text","text","text"],"type":"scatter3d","mode":"markers","name":"121T10571_12","marker":{"color":"rgba(166,206,227,1)","line":{"color":"rgba(166,206,227,1)"}},"textfont":{"color":"rgba(166,206,227,1)"},"error_y":{"color":"rgba(166,206,227,1)"},"error_x":{"color":"rgba(166,206,227,1)"},"line":{"color":"rgba(166,206,227,1)"},"frame":null},{"x":[-5.73550373147591,-6.21011122708704,-7.35383060771142,-6.59073194911667],"y":[-6.23950665019801,-6.50430598496082,-6.51161261887537,-5.34119076269499],"z":[7.24464218182632,7.38236724522226,6.0494637371315,5.38523664148418],"text":["<b>ID: <\/b>134_T6443_11_1<br /><b>NGS ID: <\/b>P8304_113","<b>ID: <\/b>134_T6443_11_2<br /><b>NGS ID: <\/b>P8304_114","<b>ID: <\/b>134_T6443_11_3<br /><b>NGS ID: <\/b>P8304_115","<b>ID: <\/b>134_T6443_11_4<br /><b>NGS ID: <\/b>P8304_116"],"hoverinfo":["text","text","text","text"],"type":"scatter3d","mode":"markers","name":"134_T6443_11","marker":{"color":"rgba(31,120,180,1)","line":{"color":"rgba(31,120,180,1)"}},"textfont":{"color":"rgba(31,120,180,1)"},"error_y":{"color":"rgba(31,120,180,1)"},"error_x":{"color":"rgba(31,120,180,1)"},"line":{"color":"rgba(31,120,180,1)"},"frame":null},{"x":[-4.6497016412439,-5.10088962658455,-6.00012520521127,-4.41802453955813],"y":[3.09565456848034,1.18448065666745,2.63713128689337,0.792488532872201],"z":[1.84057242738463,1.06376484620365,0.0898534016981559,3.4308686704621],"text":["<b>ID: <\/b>153_ST132_131<br /><b>NGS ID: <\/b>P8304_101","<b>ID: <\/b>153_ST132_132<br /><b>NGS ID: <\/b>P8304_102","<b>ID: <\/b>153_ST132_133<br /><b>NGS ID: <\/b>P8304_103","<b>ID: <\/b>153_ST132_134<br /><b>NGS ID: <\/b>P8304_104"],"hoverinfo":["text","text","text","text"],"type":"scatter3d","mode":"markers","name":"153_ST132_13","marker":{"color":"rgba(178,223,138,1)","line":{"color":"rgba(178,223,138,1)"}},"textfont":{"color":"rgba(178,223,138,1)"},"error_y":{"color":"rgba(178,223,138,1)"},"error_x":{"color":"rgba(178,223,138,1)"},"line":{"color":"rgba(178,223,138,1)"},"frame":null},{"x":[-5.88085854951221,-7.76790916625506,-6.25504507611664,-8.3764530117268],"y":[2.28585250238002,1.36384290506196,2.03080210880601,0.732589724202596],"z":[2.53910291233844,-0.247836766653928,1.897953832452,-0.233518938722922],"text":["<b>ID: <\/b>24_TD9169_081<br /><b>NGS ID: <\/b>P8304_109","<b>ID: <\/b>24_TD9169_082<br /><b>NGS ID: <\/b>P8304_110","<b>ID: <\/b>24_TD9169_083<br /><b>NGS ID: <\/b>P8304_111","<b>ID: <\/b>24_TD9169_084<br /><b>NGS ID: <\/b>P8304_112"],"hoverinfo":["text","text","text","text"],"type":"scatter3d","mode":"markers","name":"24_TD9169_08","marker":{"color":"rgba(51,160,44,1)","line":{"color":"rgba(51,160,44,1)"}},"textfont":{"color":"rgba(51,160,44,1)"},"error_y":{"color":"rgba(51,160,44,1)"},"error_x":{"color":"rgba(51,160,44,1)"},"line":{"color":"rgba(51,160,44,1)"},"frame":null},{"x":[-3.88932422329194,-0.0729461302680156],"y":[-1.69996167204044,1.77387505239342],"z":[1.96344736048856,5.74550696017447],"text":["<b>ID: <\/b>29_T1942_083<br /><b>NGS ID: <\/b>P8304_123","<b>ID: <\/b>29_T1942_084<br /><b>NGS ID: <\/b>P8304_124"],"hoverinfo":["text","text"],"type":"scatter3d","mode":"markers","name":"29_T1942_08","marker":{"color":"rgba(251,154,153,1)","line":{"color":"rgba(251,154,153,1)"}},"textfont":{"color":"rgba(251,154,153,1)"},"error_y":{"color":"rgba(251,154,153,1)"},"error_x":{"color":"rgba(251,154,153,1)"},"line":{"color":"rgba(251,154,153,1)"},"frame":null},{"x":[-10.2163172144276,-10.596078285728,-10.2353954116357,-9.33007941422633],"y":[-0.490190092826988,-2.26662762461056,-0.333539418783384,-0.0554168358930101],"z":[-8.46229337166764,-8.5409366265751,-8.94003110723548,-8.17218218493106],"text":["<b>ID: <\/b>61_T1538_071<br /><b>NGS ID: <\/b>P8304_105","<b>ID: <\/b>61_T1538_072<br /><b>NGS ID: <\/b>P8304_106","<b>ID: <\/b>61_T1538_073<br /><b>NGS ID: <\/b>P8304_107","<b>ID: <\/b>61_T1538_074<br /><b>NGS ID: <\/b>P8304_108"],"hoverinfo":["text","text","text","text"],"type":"scatter3d","mode":"markers","name":"61_T1538_07","marker":{"color":"rgba(227,26,28,1)","line":{"color":"rgba(227,26,28,1)"}},"textfont":{"color":"rgba(227,26,28,1)"},"error_y":{"color":"rgba(227,26,28,1)"},"error_x":{"color":"rgba(227,26,28,1)"},"line":{"color":"rgba(227,26,28,1)"},"frame":null},{"x":[21.8493946916054,22.7364624888557,22.8684179809813,23.401941446664],"y":[-5.14341595704935,-6.83851698747042,-14.3376040568602,-8.02483675387452],"z":[1.5998970735274,0.863612874314833,-7.37316041937378,-1.33865318696138],"text":["<b>ID: <\/b>TD11549_17_O1<br /><b>NGS ID: <\/b>P8304_125","<b>ID: <\/b>TD11549_17_O2<br /><b>NGS ID: <\/b>P8304_126","<b>ID: <\/b>TD11549_17_O3<br /><b>NGS ID: <\/b>P8304_127","<b>ID: <\/b>TD11549_17_O4<br /><b>NGS ID: <\/b>P8304_128"],"hoverinfo":["text","text","text","text"],"type":"scatter3d","mode":"markers","name":"TD11549_17_O","marker":{"color":"rgba(253,191,111,1)","line":{"color":"rgba(253,191,111,1)"}},"textfont":{"color":"rgba(253,191,111,1)"},"error_y":{"color":"rgba(253,191,111,1)"},"error_x":{"color":"rgba(253,191,111,1)"},"line":{"color":"rgba(253,191,111,1)"},"frame":null},{"x":[14.4253959187119,13.2889594437547,10.7843904183293,11.3552346888775],"y":[15.1368414992242,12.1873998562284,13.2999768462921,10.3529397410905],"z":[1.81496155659233,-0.3728142071169,-0.865737731812759,-1.18694306702993],"text":["<b>ID: <\/b>TD11558_17_L1<br /><b>NGS ID: <\/b>P8304_129","<b>ID: <\/b>TD11558_17_L2<br /><b>NGS ID: <\/b>P8304_130","<b>ID: <\/b>TD11558_17_L3<br /><b>NGS ID: <\/b>P8304_131","<b>ID: <\/b>TD11558_17_L4<br /><b>NGS ID: <\/b>P8304_132"],"hoverinfo":["text","text","text","text"],"type":"scatter3d","mode":"markers","name":"TD11558_17_L","marker":{"color":"rgba(255,127,0,1)","line":{"color":"rgba(255,127,0,1)"}},"textfont":{"color":"rgba(255,127,0,1)"},"error_y":{"color":"rgba(255,127,0,1)"},"error_x":{"color":"rgba(255,127,0,1)"},"line":{"color":"rgba(255,127,0,1)"},"frame":null}],"highlight":{"on":"plotly_click","persistent":false,"dynamic":false,"selectize":false,"opacityDim":0.2,"selected":{"opacity":1},"debounce":0},"base_url":"https://plot.ly"},"evals":["config.modeBarButtonsToAdd.0.click"],"jsHooks":[]}</script> <i class="fas fa-toolbox"></i> [`cmdscale()`](https://stat.ethz.ch/R-manual/R-devel/library/stats/html/cmdscale.html), [plotly](https://plot.ly/r/) --- name: batch-correction class: spaced ## Batch correction - Estimate variation explained by variables (.medium[PVCA]) .size-70[] - Find confounding effects as surrogate variables (.medium[SVA]) - Model known batches in the LM/GLM model - Correct known batches (.medium[ComBat])(Harsh!) - Interactively evaluate batch effects and correction (.medium[BatchQC]) <i class="fas fa-toolbox"></i> [SVA](http://bioconductor.org/packages/release/bioc/html/sva.html), [PVCA](https://bioconductor.org/packages/release/bioc/html/pvca.html), [BatchQC](http://bioconductor.org/packages/release/bioc/html/BatchQC.html) .citation[ <span style="display:block;"><i class="fas fa-link"></i> Liu, Qian, and Marianthi Markatou. "Evaluation of methods in removing batch effects on RNA-seq data." [Infectious Diseases and Translational Medicine 2.1 (2016): 3-9](http://www.tran-med.com/article/2016/2411-2917-2-1-3.html)</span> <span style="display:block;"><i class="fas fa-link"></i> Manimaran, Solaiappan, et al. "BatchQC: interactive software for evaluating sample and batch effects in genomic data." [Bioinformatics 32.24 (2016): 3836-3838](https://academic.oup.com/bioinformatics/article/32/24/3836/2525651)</span> ] --- name: dge-1 ## DGE - DESeq2, edgeR (Neg-binom > GLM > Test), Limma-Voom (Neg-binom > Voom-transform > LM > Test) - DESeq2 `~age+condition` - Estimate size factors `estimateSizeFactors()` - Estimate gene-wise dispersion `estimateDispersions()` - Fit curve to gene-wise dispersion estimates - Shrink gene-wise dispersion estimates - GLM fit for each gene - Wald test `nbinomWaldTest()` <img src="talk_files/figure-html/unnamed-chunk-10-1.svg" style="display: block; margin: auto auto auto 0;" /> <i class="fas fa-toolbox"></i> [DESeq2](), [edgeR](), [Limma-Voom]() .citation[ <span style="display:block;"><i class="fas fa-link"></i> Seyednasrollah, Fatemeh, *et al*. "Comparison of software packages for detecting differential expression in RNA-seq studies." [Briefings in bioinformatics 16.1 (2013): 59-70](https://academic.oup.com/bib/article/16/1/59/240754)</span> ] --- name: dge-2 ## DGE - Results `results()` ``` ## log2 fold change (MLE): type type2 vs control ## Wald test p-value: type type2 vs control ## DataFrame with 1 row and 6 columns ## baseMean log2FoldChange lfcSE ## <numeric> <numeric> <numeric> ## ENSG00000000003 242.307796723287 -0.932926089608558 0.114285150312647 ## stat pvalue ## <numeric> <numeric> ## ENSG00000000003 -8.16314356726468 3.26416150312236e-16 ## padj ## <numeric> ## ENSG00000000003 1.36240610027518e-14 ``` - Summary `summary()` ``` ## ## out of 17889 with nonzero total read count ## adjusted p-value < 0.1 ## LFC > 0 (up) : 4526, 25% ## LFC < 0 (down) : 5062, 28% ## outliers [1] : 25, 0.14% ## low counts [2] : 0, 0% ## (mean count < 3) ## [1] see 'cooksCutoff' argument of ?results ## [2] see 'independentFiltering' argument of ?results ``` --- name: dge-3 ## DGE .pull-left-50[ - MA plot `plotMA()` <img src="talk_files/figure-html/unnamed-chunk-13-1.svg" style="display: block; margin: auto auto auto 0;" /> - Volcano plot <img src="talk_files/figure-html/unnamed-chunk-14-1.svg" style="display: block; margin: auto auto auto 0;" /> ] .pull-right-50[ - Normalised counts `plotCounts()` <img src="talk_files/figure-html/unnamed-chunk-15-1.svg" style="display: block; margin: auto auto auto 0;" /> <img src="images/scattered.gif" style="height:220px; position:fixed; right:0px; bottom:0px; margin-right: 130px; margin-bottom: 10px;"> ] --- name: functional-analysis-1 ## Functional analysis | GO - Gene enrichment analysis - Gene set enrichment analysis (GSEA) - Gene ontology / Reactome databases .size-80[] <img src="images/systembio.png" style="height:220px; position:fixed; right:0px; bottom:0px; margin-right: 70px; margin-bottom: 380px;"> --- name: functional-analysis-2 ## Functional analysis | Kegg - Pathway analysis (Kegg)  <i class="fas fa-toolbox"></i> [DAVID](https://david.ncifcrf.gov/), [clusterProfiler](https://bioconductor.org/packages/release/bioc/html/clusterProfiler.html), [ClueGO](http://apps.cytoscape.org/apps/cluego), [ErmineJ](https://erminej.msl.ubc.ca/), [pathview](https://bioconductor.org/packages/release/bioc/html/pathview.html) --- name: sc-1 ## Single cell RNA-Seq - Bulk RNA-Seq measures mean expression-level over many cells - Poor resolution for development, differentiation, heterogenous tissues - Identify cell types in a tissue - Temporal/spatial/conditional change in cellular state and composition .size-70[] - Zero-inflated data (~80% missing data) - Transcriptional bursting, drop-out - Low RNA, Poor capture efficiency - Amplification bias and background noise .citation[ <span style="display:block;"><i class="fas fa-link"></i> Svensson, Valentine, Roser Vento-Tormo, and Sarah A. Teichmann. "Exponential scaling of single-cell RNA-seq in the past decade." [Nature protocols 13.4 (2018): 599](https://www.nature.com/articles/nprot.2017.149)</span> ] --- name: sc-2 ## scRNA-Seq | Example .pull-left-50[ .size-90[] ] .pull-right-50[  ] .citation[ <span style="display:block;"><i class="fas fa-link"></i> Sebe-Pedros, Arnau, et al. "Cnidarian Cell Type Diversity and Regulation Revealed by Whole-Organism Single-Cell RNA-Seq." [Cell 173.6 (2018): 1520-1534](https://www.sciencedirect.com/science/article/pii/S0092867418305968)</span> <span style="display:block;"><i class="fas fa-link"></i> Plass, Mireya, et al. "Cell type atlas and lineage tree of a whole complex animal by single-cell transcriptomics." [Science 360.6391 (2018): eaaq1723](http://science.sciencemag.org/content/360/6391/eaaq1723)</span> ] --- name: new-advances ## New Advances - [Long read single molecule RNA-Seq](https://biotechnologyforbiofuels.biomedcentral.com/articles/10.1186/s13068-018-1167-z) (.medium[.altcol[Zuo *et al.*, 2018]]) .size-40[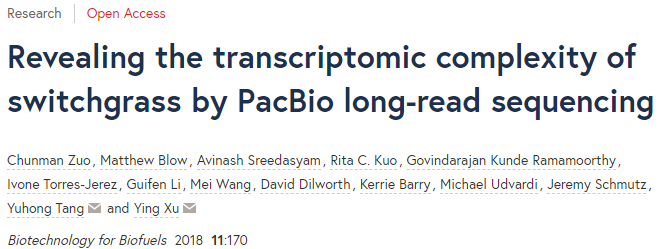] - [Single-cell isoform RNA-Seq](https://www.biorxiv.org/content/early/2018/07/08/364950) (.medium[.altcol[Ishaan *et al.*, 2018]]) .size-60[] - [Single-cell lineage tracing](https://www.nature.com/articles/s41586-018-0414-6) (.medium[.altcol[Manno *et al.*, 2018]]) .size-80[] --- name: summary class: spaced ## Summary - Nothing can fix a poor experimental design - Plan carefully about lib prep, sequencing etc based on experimental objective - Biological replicates may be more important than paired-end reads or long reads - Discard low quality bases, reads, genes and samples - QC! QC everything at every step - Verify that tools and methods align with data assumptions - Experiment with multiple pipelines and tools .large[<i class="fas fa-link"></i> Conesa, Ana, *et al.* "A survey of best practices for RNA-seq data analysis." [Genome biology 17.1 (2016): 13](https://genomebiology.biomedcentral.com/articles/10.1186/s13059-016-0881-8)] --- name: help class: spaced ## Further learning - Griffith lab [RNA-Seq using HiSat & StringTie tutorial](https://github.com/griffithlab/rnaseq_tutorial/wiki) - SciLifeLab [courses](https://www.scilifelab.se/education/courses%26training) - HBC Training [DGE using DeSeq2 tutorial](https://github.com/hbctraining/Intro-to-R-with-DGE) - Hemberg lab [scRNA-Seq tutorial](http://hemberg-lab.github.io/scRNA.seq.course/index.html) - [RNA-Seq Blog](https://www.rna-seqblog.com/) <img src="images/help.png" style="height:200px; position:fixed; right:0px; bottom:0px; margin-right: 100px; margin-bottom: 20px;"> --- name: end-slide class: end-slide # Thank you! Questions? <p style="text-align: left; font-size: small;"> Built on : <i class='fa fa-calendar' aria-hidden='true'></i> 12-Sep-2018 at <i class='fa fa-clock-o' aria-hidden='true'></i> 21:33:47 </p> <hr> <b>2018</b> Roy Francis | [SciLifeLab](https://www.scilifelab.se/) | [NBIS](https://nbis.se/) --- name: session ## Session .small[This presentation was created in [RStudio](https://www.rstudio.com/products/rstudio/) using [`remarkjs`](https://github.com/gnab/remark) framework through R package [`xaringan`](https://github.com/yihui/xaringan).] .medium[ ```r getS3method("print","sessionInfo")(sessionInfo()[-7]) ``` ``` ## R version 3.5.1 (2018-07-02) ## Platform: x86_64-w64-mingw32/x64 (64-bit) ## Running under: Windows >= 8 x64 (build 9200) ## ## Matrix products: default ## ## locale: ## [1] LC_COLLATE=English_United Kingdom.1252 ## [2] LC_CTYPE=English_United Kingdom.1252 ## [3] LC_MONETARY=English_United Kingdom.1252 ## [4] LC_NUMERIC=C ## [5] LC_TIME=English_United Kingdom.1252 ## ## attached base packages: ## [1] parallel stats4 stats graphics grDevices utils datasets ## [8] methods base ## ## other attached packages: ## [1] bindrcpp_0.2.2 DESeq2_1.20.0 ## [3] SummarizedExperiment_1.10.1 DelayedArray_0.6.5 ## [5] BiocParallel_1.14.2 matrixStats_0.54.0 ## [7] Biobase_2.40.0 GenomicRanges_1.32.6 ## [9] GenomeInfoDb_1.16.0 IRanges_2.14.11 ## [11] S4Vectors_0.18.3 BiocGenerics_0.26.0 ## [13] plotly_4.8.0 ggplot2_3.0.0 ## [15] pheatmap_1.0.10 dplyr_0.7.6 ## [17] bookdown_0.7 knitr_1.20 ``` ]